AI scientific figures, made simple.
An AI scientific figure generator for research papers: turn text, manuscripts and data into publication-ready scientific illustrations, diagrams and plots — then edit every label, layer and color on an infinite canvas.
No credit card · illustrations, flowcharts and plots in one place
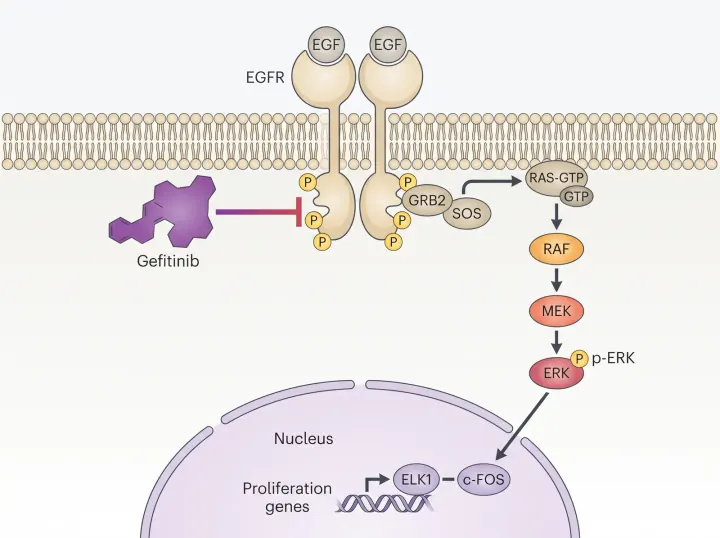
Image · Nano Banana Pro
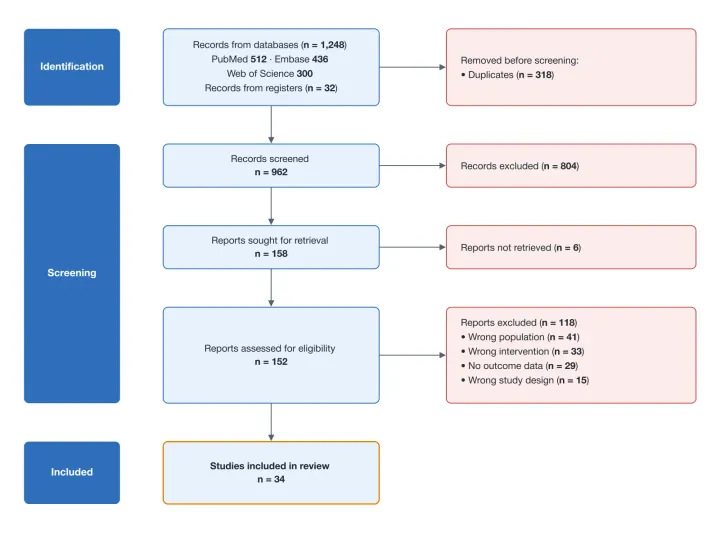
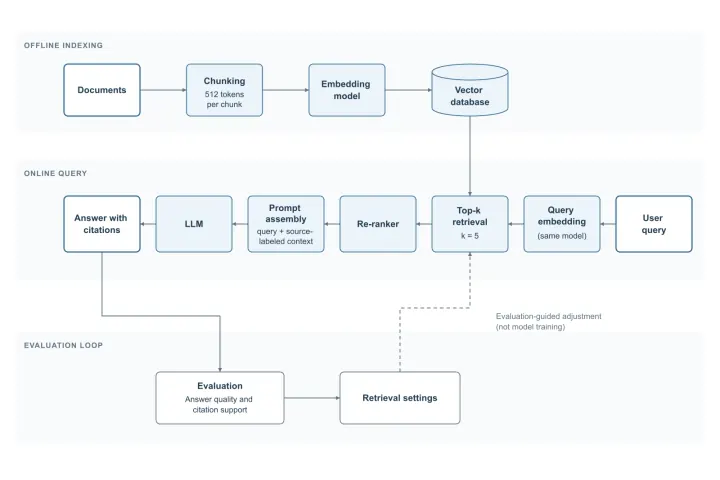
SVG · editable text
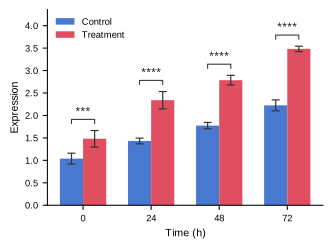
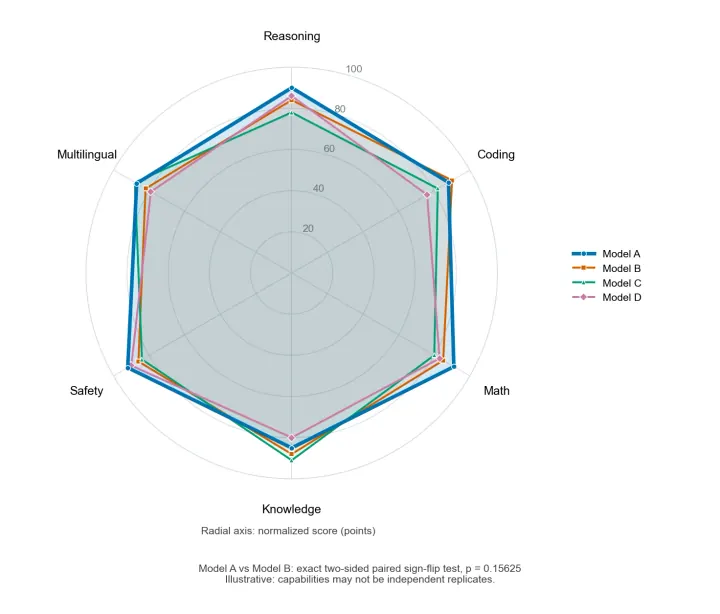
SVG · Python script
Figure conventions for the journals you submit to
Scientific illustrations, diagrams and plots — one AI figure generator
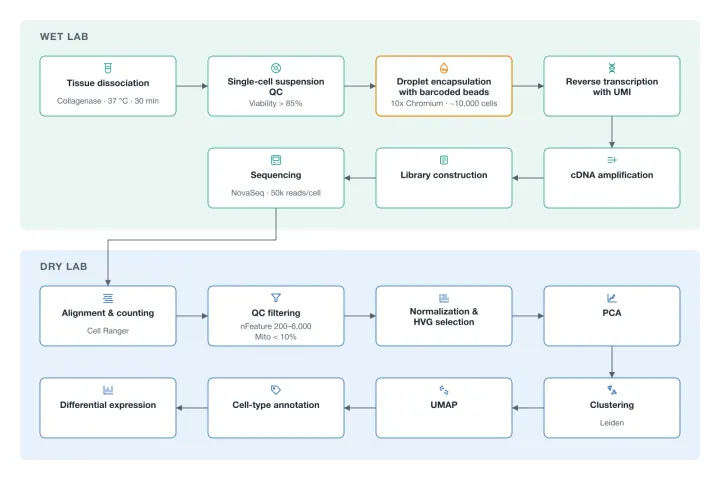
The agent reads your request and routes it to the right engine — image models for illustrations, editable vectors for diagrams, and code that plots your data exactly.
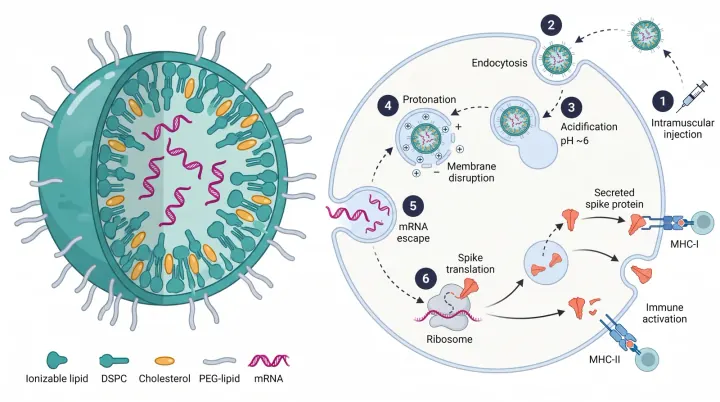
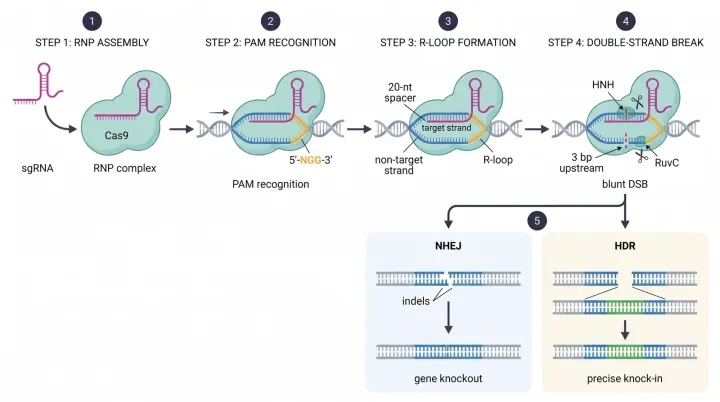
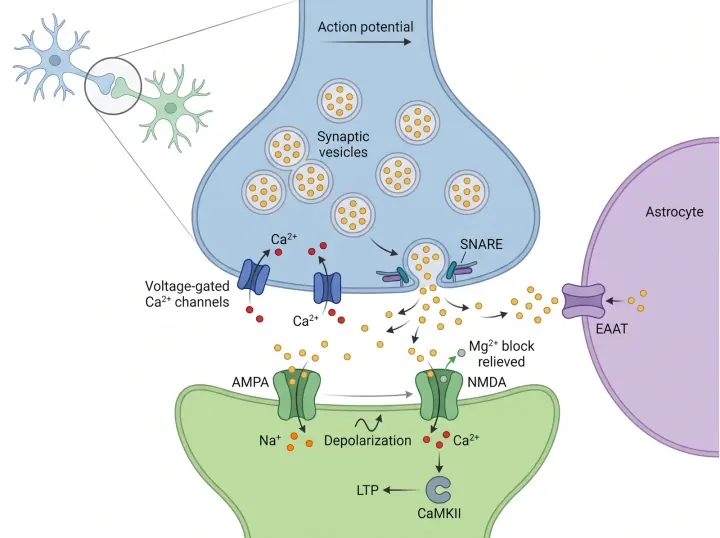
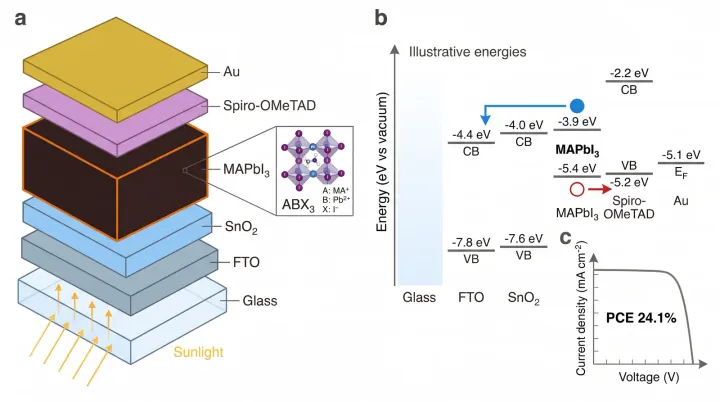
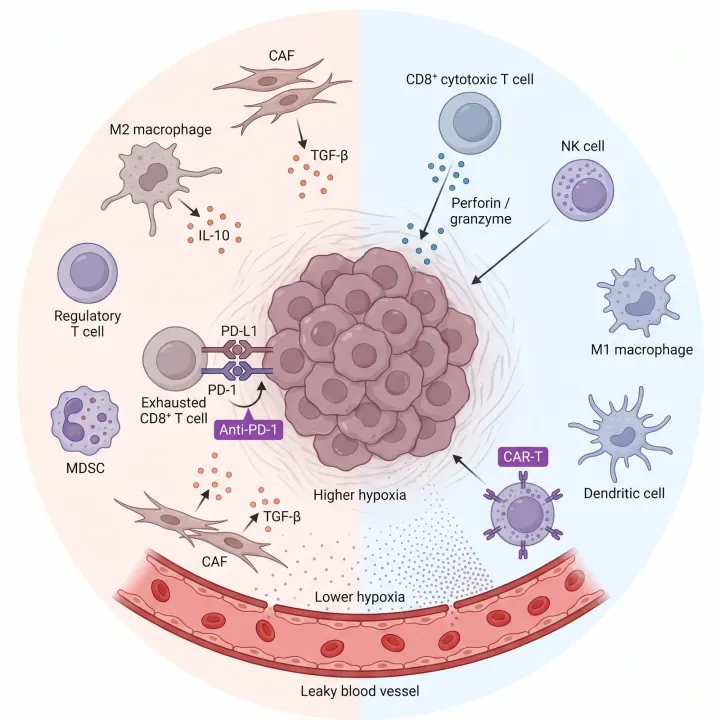
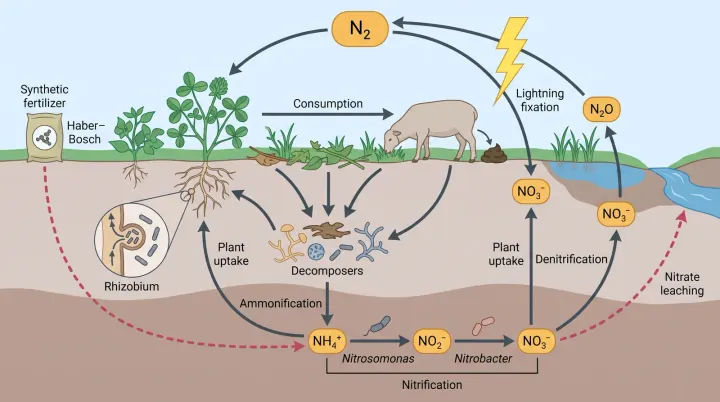
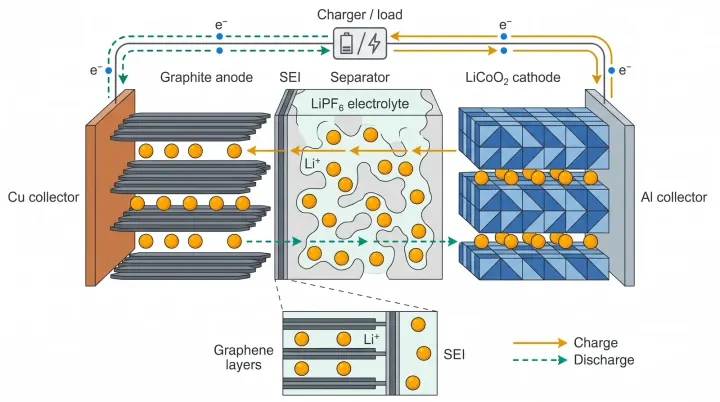
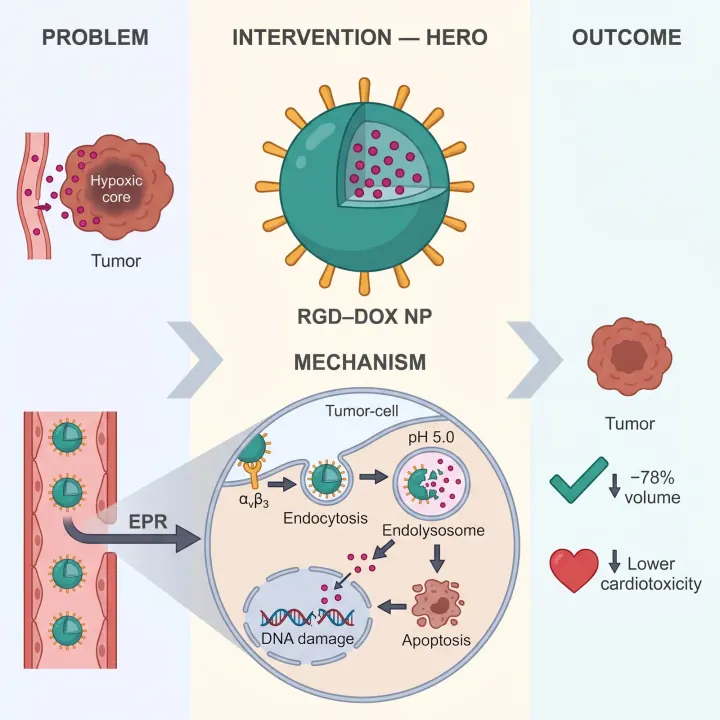
Turn text or sketches into publication-ready scientific illustrations for biology, medicine, chemistry and beyond.
Prompt planned by the agent: layout, labels and palette
7 image models: Nano Banana, GPT Image, Seedream and Qwen
Convert to editable vectors, split into layers, or polish with AI render
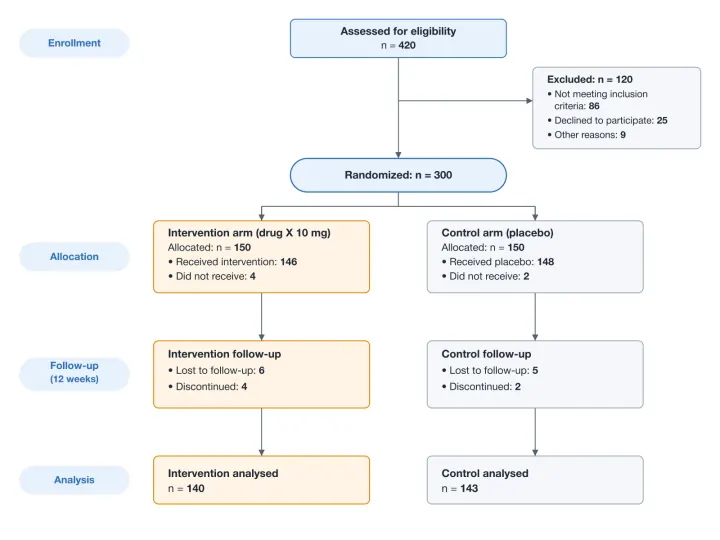
2.3 Study design
4 / 18
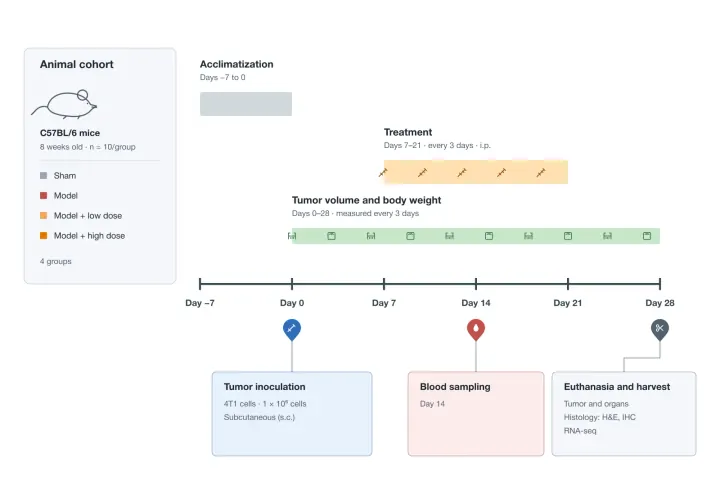
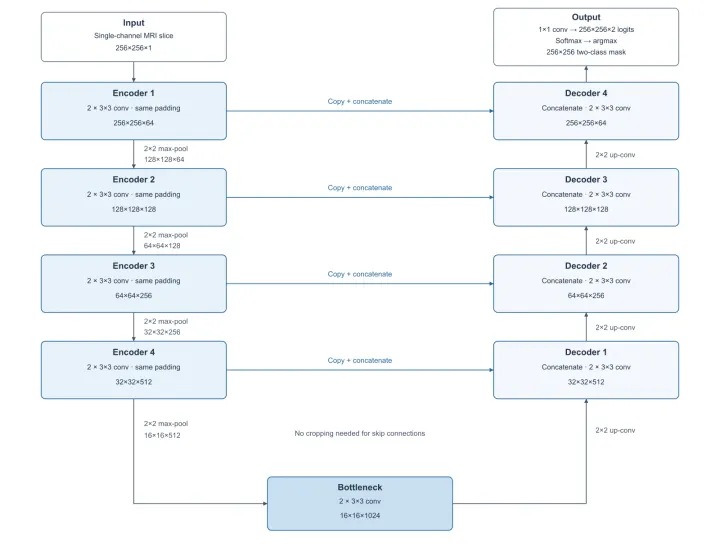
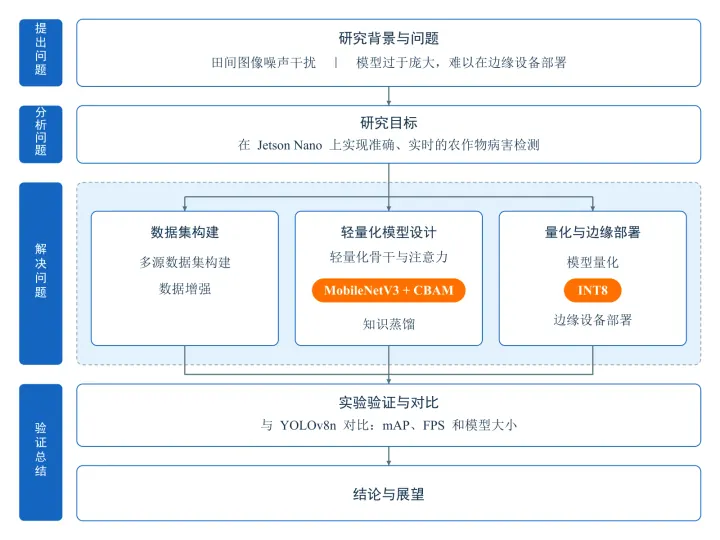
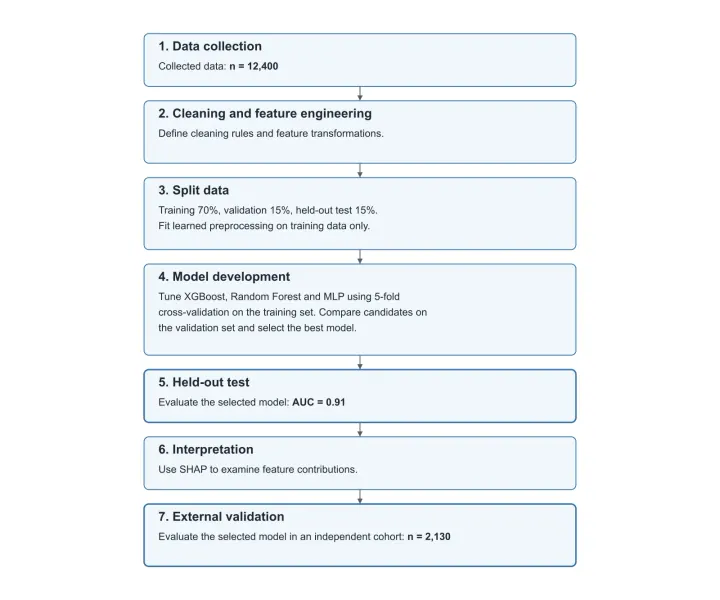
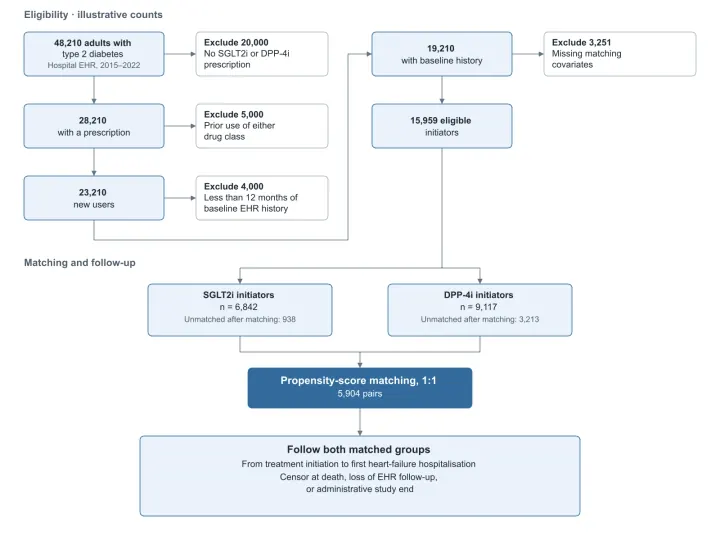
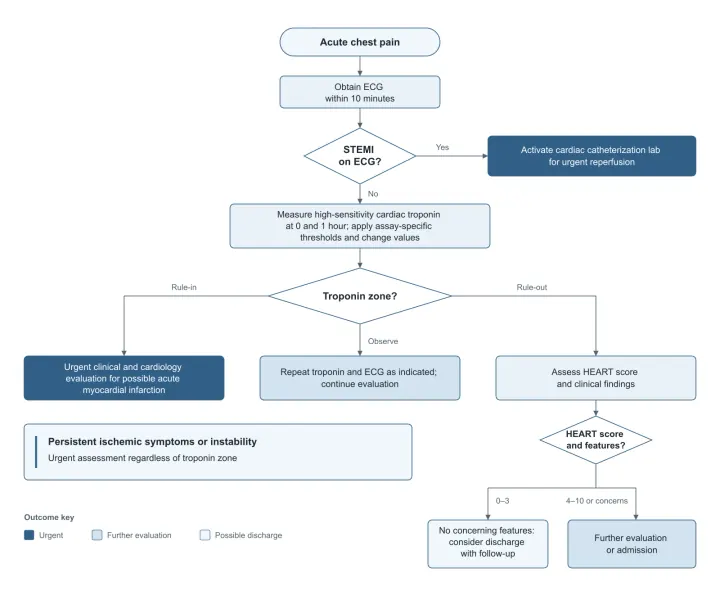
Flowchart · SVG
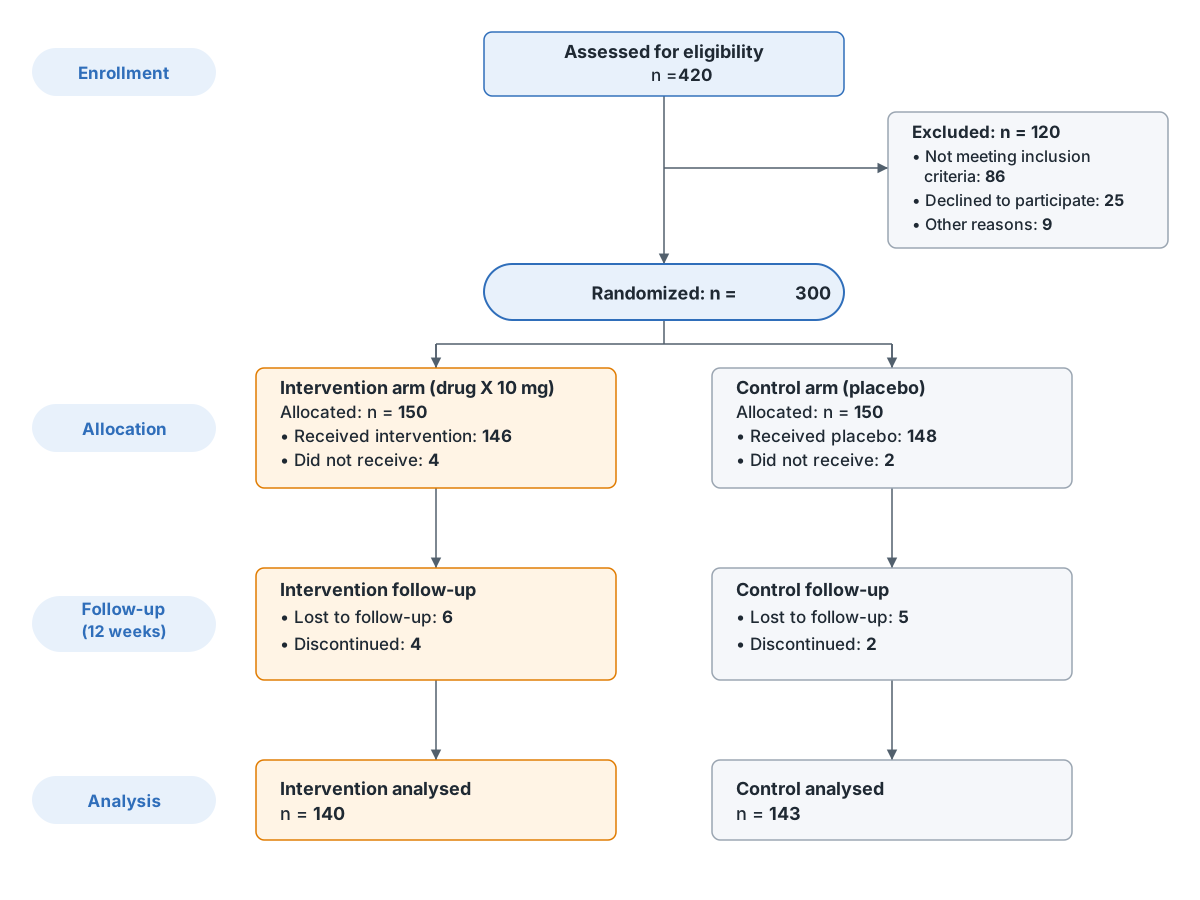
Draw straight from your paper
Upload the manuscript and say which section or page to use. The agent finds the passage and builds the figure from your paper's own terms, entities and numbers.
PDF, Word, LaTeX, Markdown and plain text
Finds the passage from your words or a page number
Labels and numbers quote the paper — nothing invented
Tells you which page it used, so you can check
From a notebook sketch to a journal figure
Snap a photo of your whiteboard or notebook. SciChat keeps your layout and redraws it at publication quality. Drag the slider to compare.
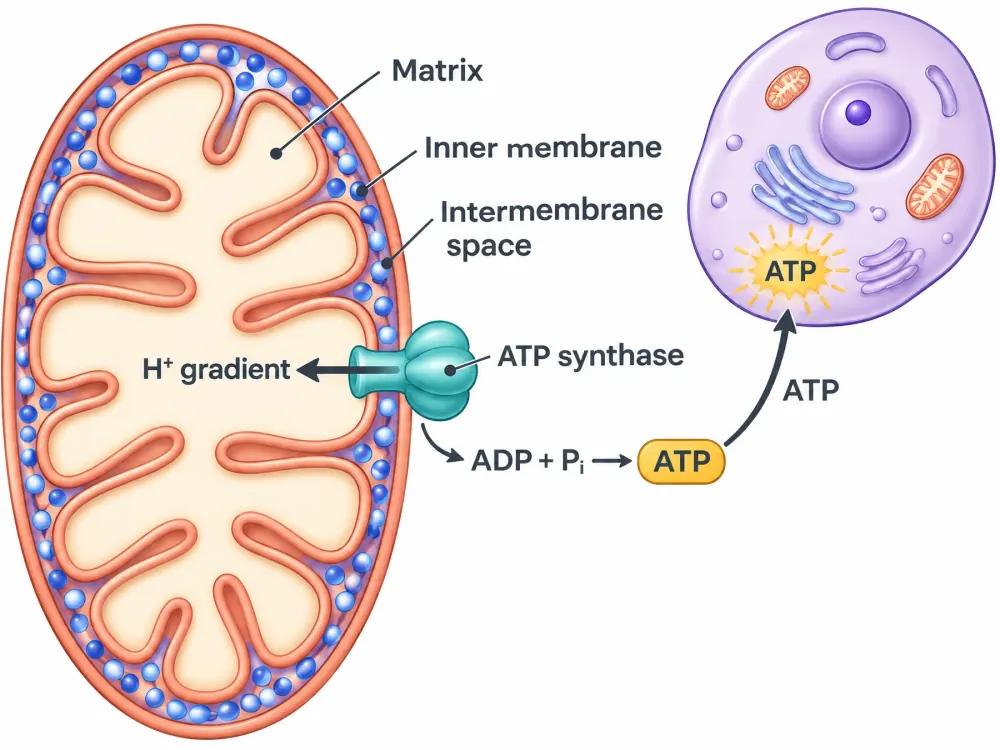
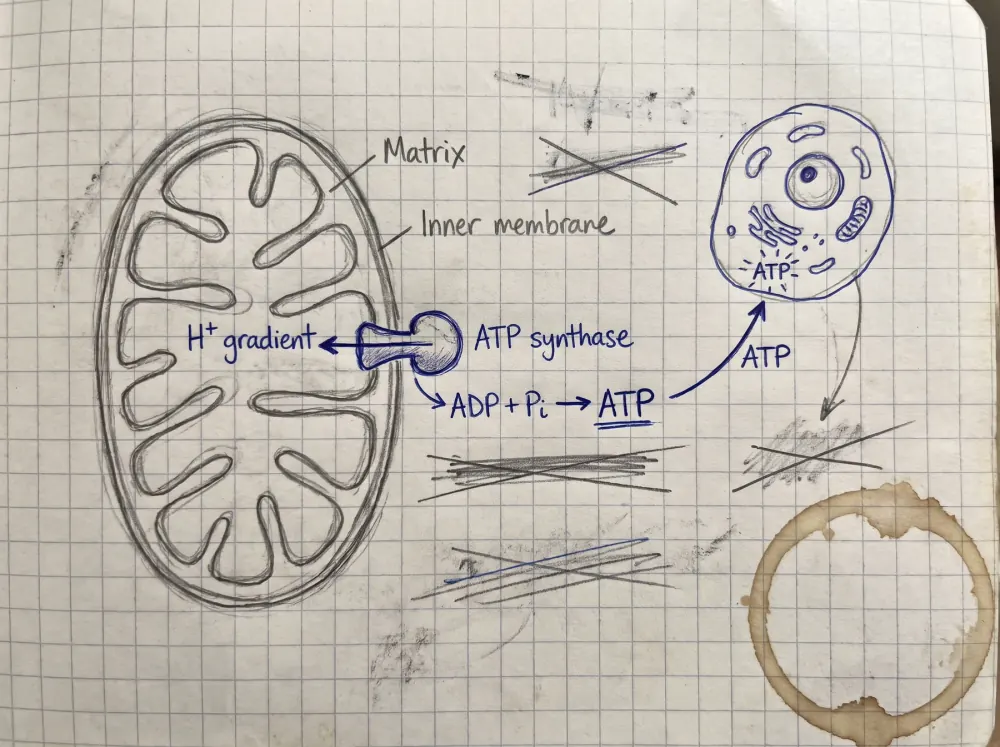
Plain image · PNG
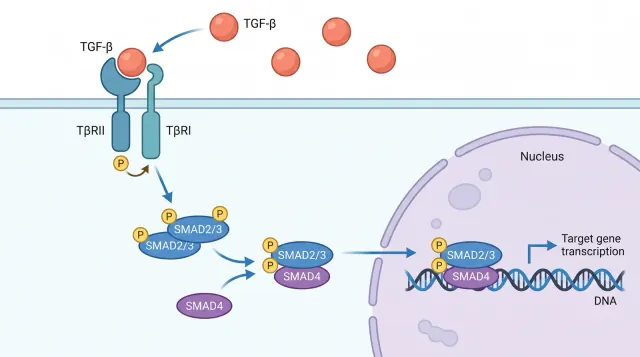
Vector · SVG
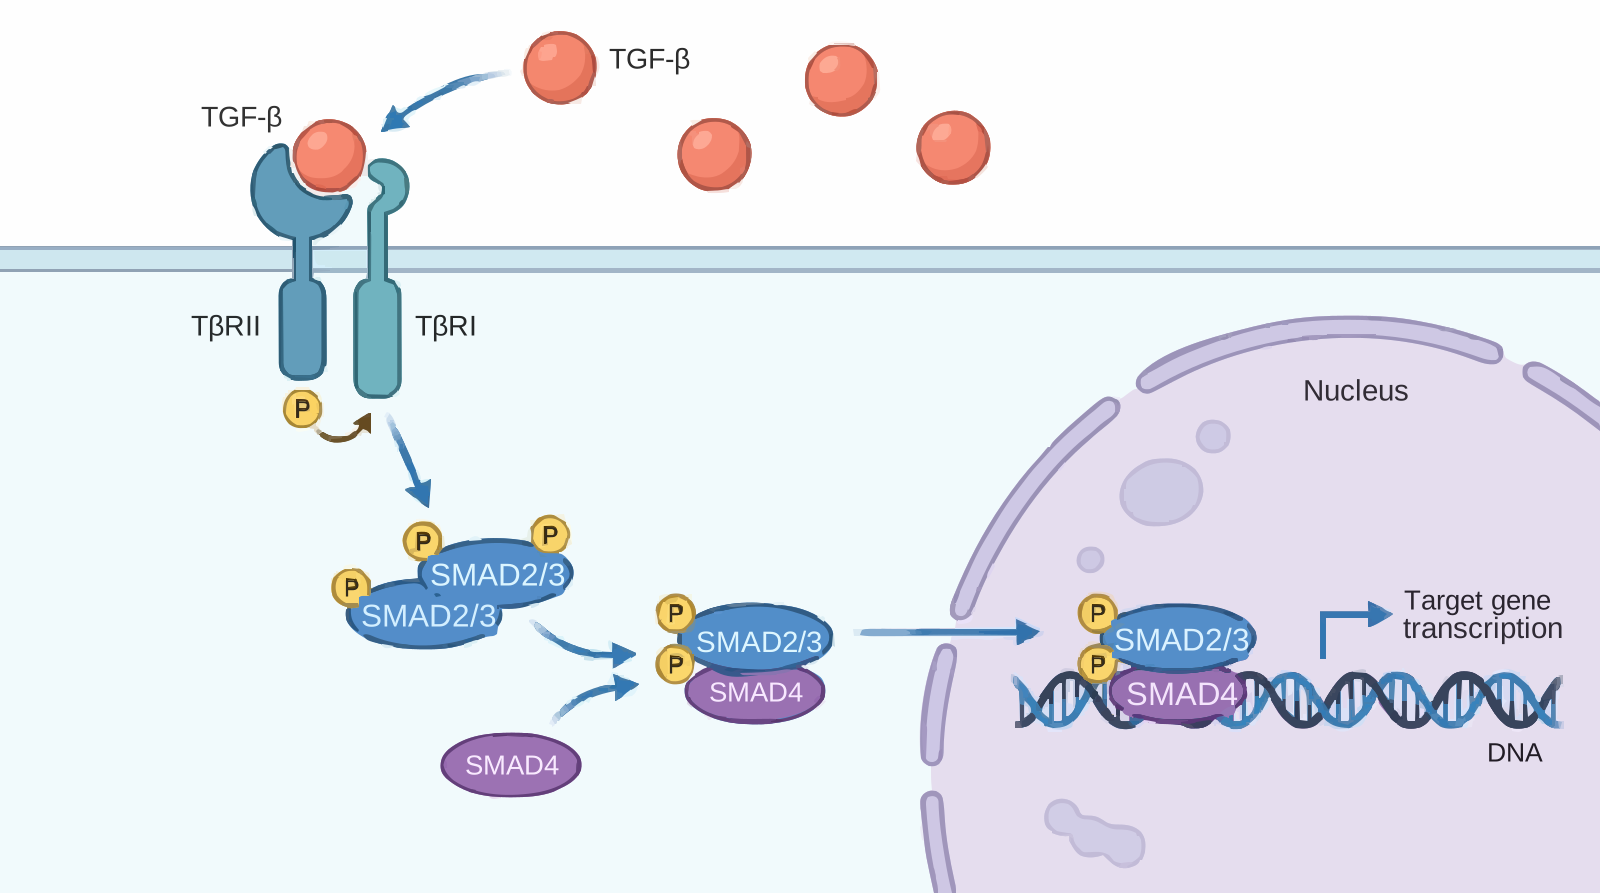
Turn any image into an editable vector figure
Smart vectorization reads every label with OCR, removes it from the image, traces the graphics and puts the text back as real, editable text.
Labels become live text you can retype, restyle or translate
Graphics traced into clean SVG layers
A render-and-compare check scores fidelity to the original
Split complex figures into separate layers
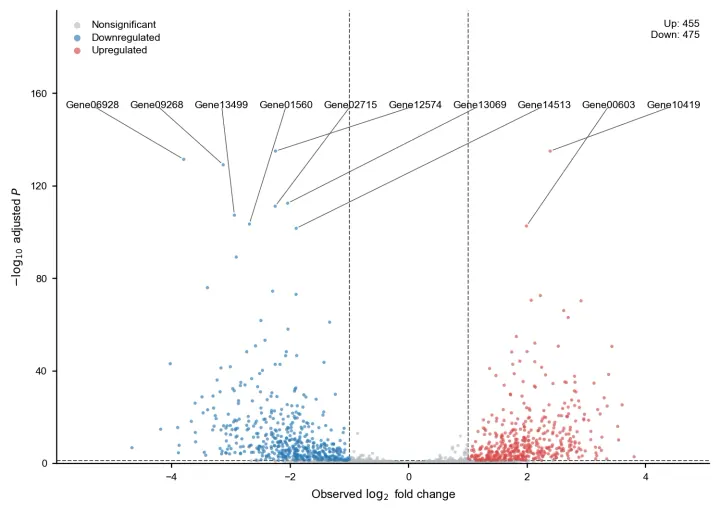
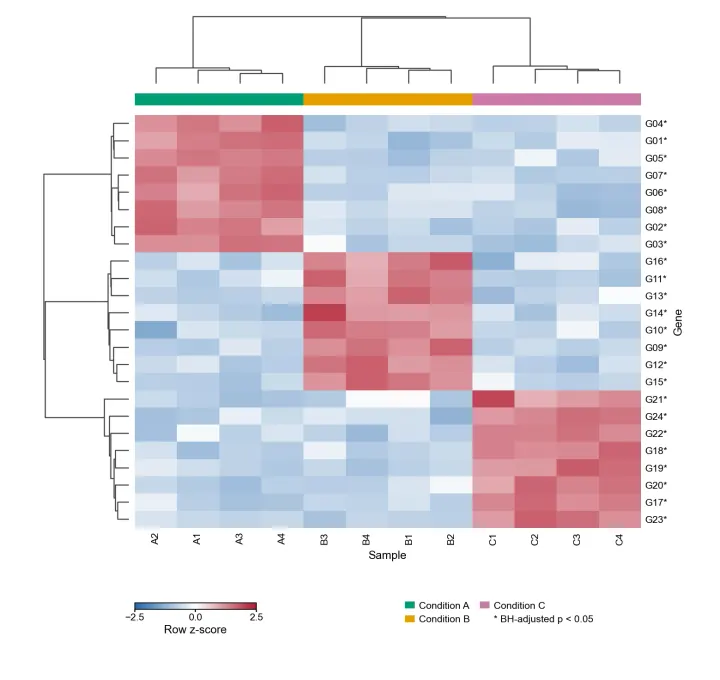
Statistics computed, not guessed
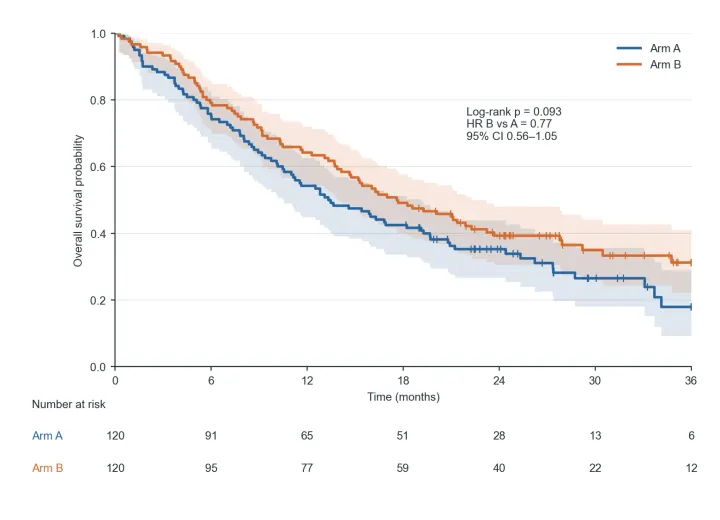
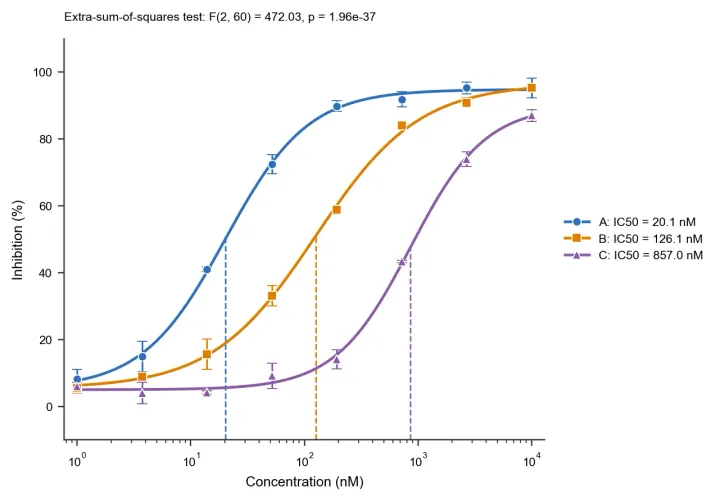
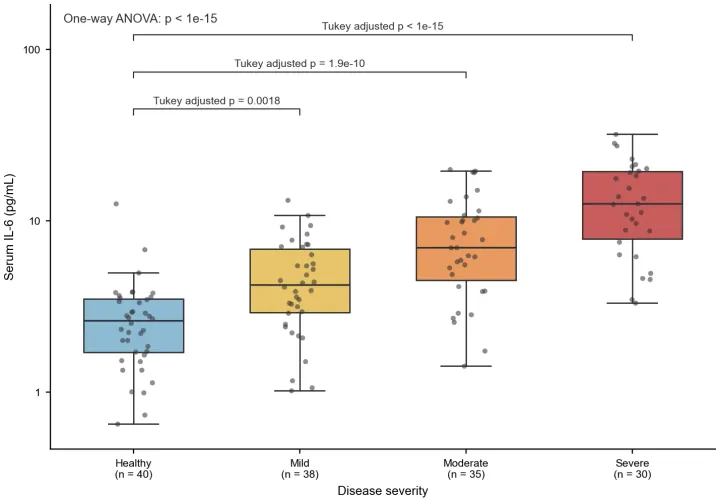
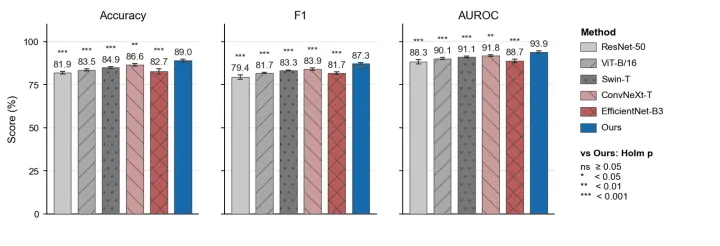
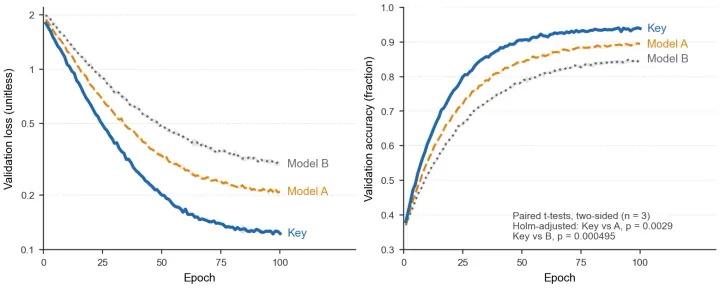
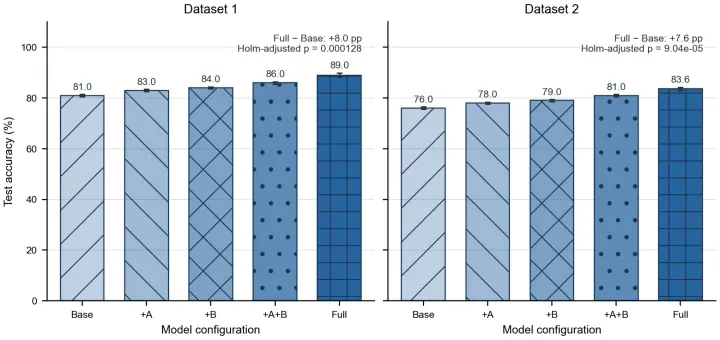
Upload CSV, TSV or Excel and describe the figure. Tests, fits and models run in code on your data, and the figure is sized to your journal's column.
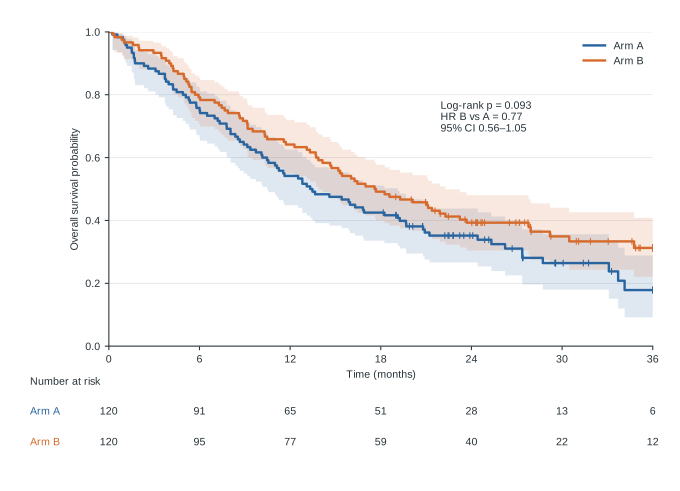
Every p-value and fitted curve is computed from your data
Single- or double-column width for Nature, Science, Cell and more
Overlapping labels and cramped panels are fixed before you see the figure
Export the Python and R scripts and rerun them on new data
Drop it straight into your slides
Export vector figures as editable PowerPoint: every shape, arrow and text box is a native object you can re-word, recolor and move in PowerPoint, Keynote or WPS — no need to go back to the source file.
Labels are real text boxes you can rewrite or translate
Shapes keep their fills, strokes and arrowheads
Slides are sized to your figure, ready to present
SVG, PNG, JPG and R / Python script exports too
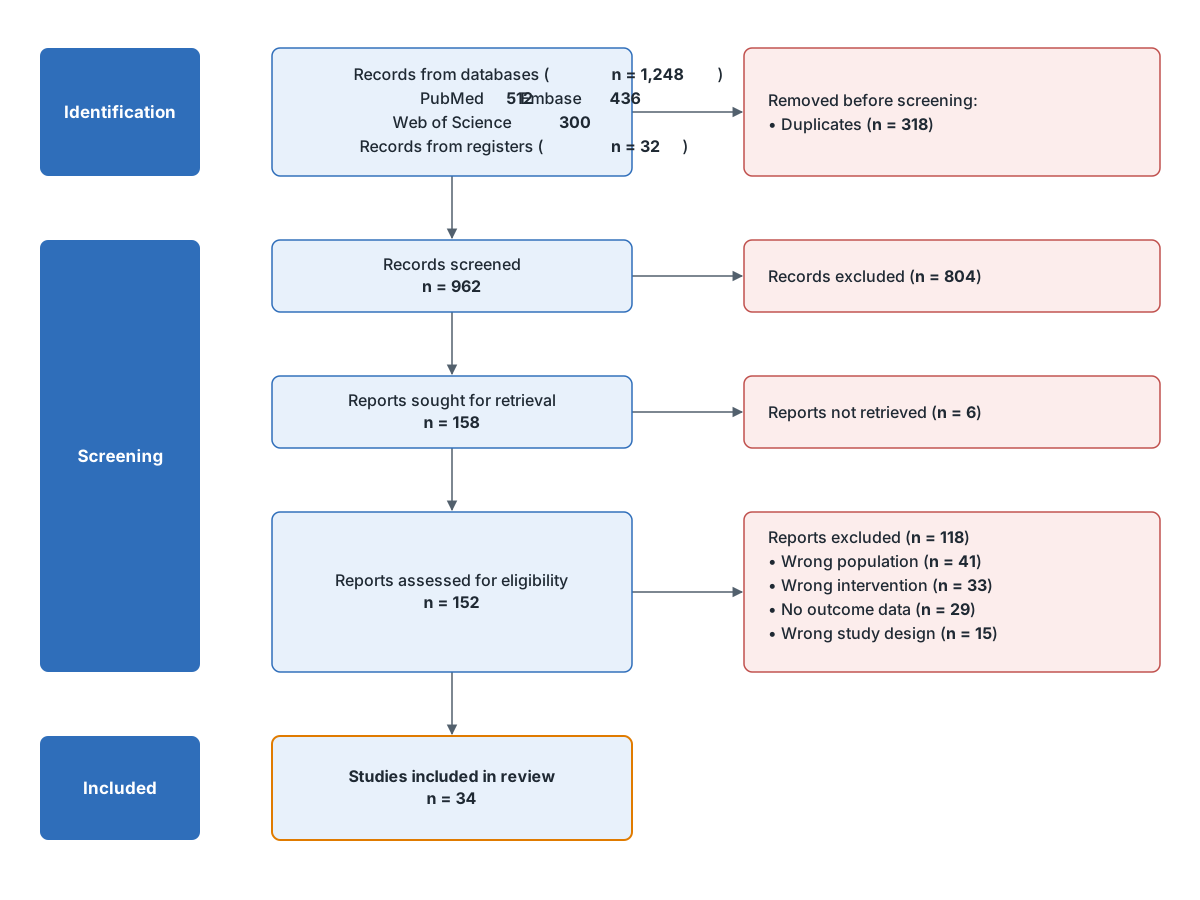
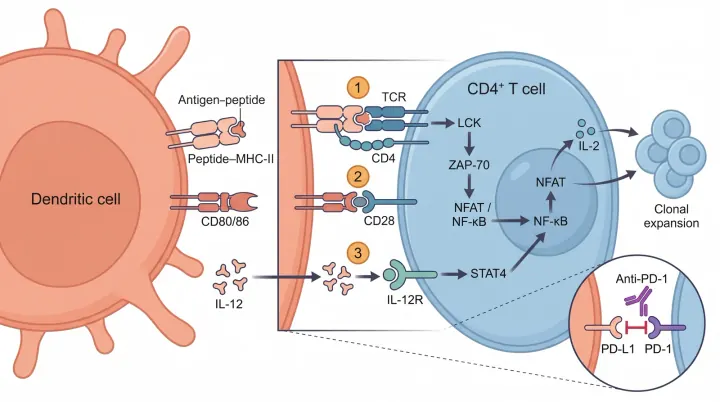
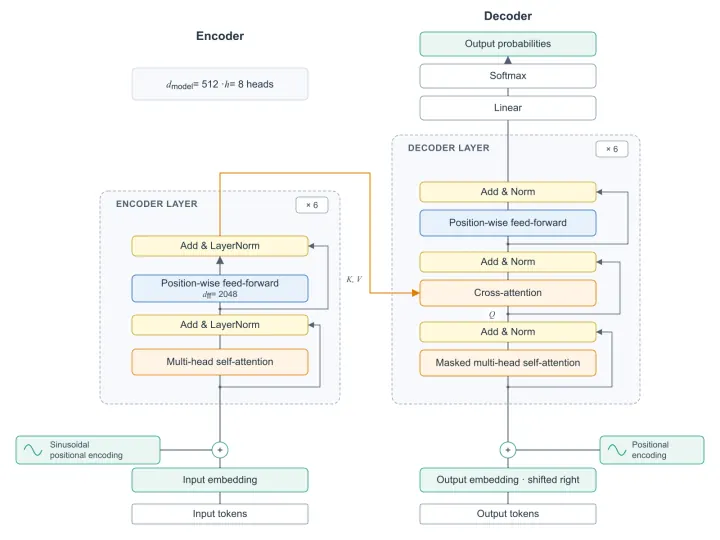
Scientific figure templates that already work
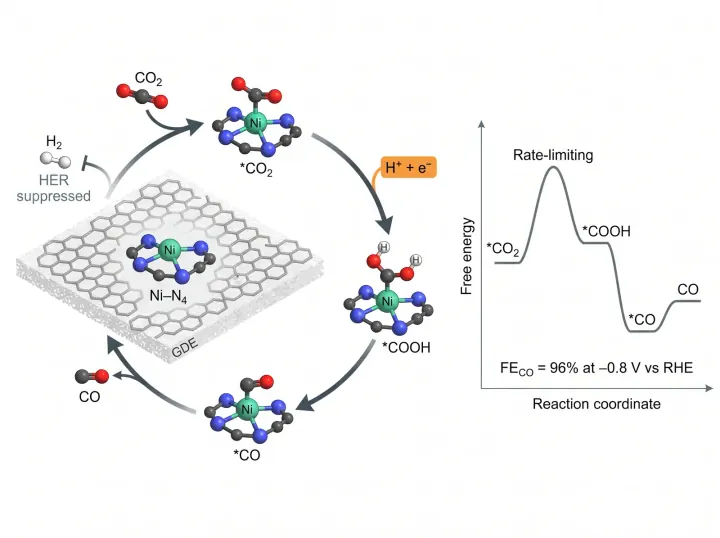
Biology, medicine, chemistry, AI and more. Every template pairs a reusable visual style with content you can swap — keep the look, change the science.
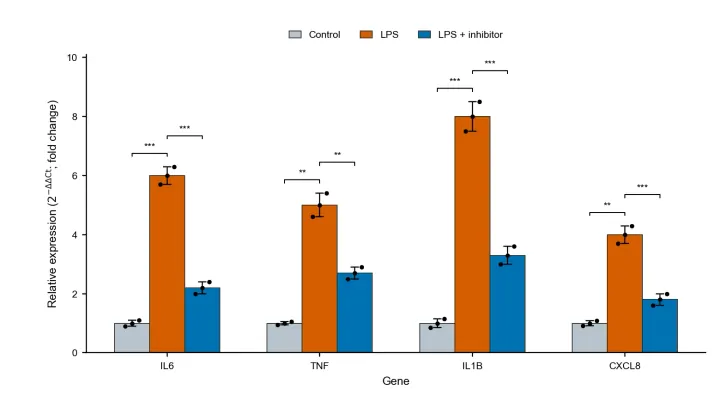
Everything after the first draft
Agent chat
Ask for changes in plain language — “thicker arrows”, “add a panel for mTOR”, “match Nature style”.
Infinite canvas
Keep every version side by side, drag figures around, compare and iterate.
Vector editor
Select, move, recolor, resize and retype any element. Layers, undo and keyboard shortcuts.
Journal-ready styling
Nature, Science, Cell, PLOS and ACS fonts, sizes and column widths.
SCICHATPublication Authorization
SC-2026-7F3A9C21
SHA-256 · 9d4e…b71a
ValidAuthorization certificate
A signed PDF bound to the exact file by its fingerprint.
Layer split
Split an AI image into separate layers and nudge each element on the canvas.
Mark a region
Circle the part you want changed and tell the agent — the rest stays as it is.
How it works
Bring anything
Text, papers (PDF / Word / LaTeX), sketches, lab photos, CSV / Excel or reference figures.
Pick your engine
Let the agent choose, or pick a model, style, palette and aspect ratio.
Refine on canvas
Chat for revisions, mark a region to change, drag flowcharts, split layers, turn images into editable vectors.
Ship it
Editable PPTX, SVG, high-resolution PNG / JPG, Python / R scripts behind plots (paid plans), and a certificate.
Simple pricing, generous credits
Start free with credits every month. Upgrade when your paper needs more — editing and exporting never cost a thing.
Questions researchers ask
Stop drawing. Start publishing.
Your next scientific figure is one sentence away.